GLOBISENS SCIENCE, CODING and ART APPS
Designed with the Latest Google Flutter platform – XploriLab is consolidating 5 different software modules to deliver an integrated STEAM experience to k-6 students, covering: Science, Control, Coding and Art. GlobilLab for K-12 science: Engage with science concepts, analysis and collaboration. GlobiLab offers advanced GPS plotting, analysis, management and presentation tools for grades 6 to 12. Reflecting global scientific research, the GlobiCollab integrates up to 8 Labdisc data display and analysis for a collaborative science learning approach. GlobiWorld introduces elementary school students to seven captivating science theme parks.
Collect and visualize measurements, analyze data and develop a skilled scientific response
Xplorilab for SCIENCE DATA LOGGING AND CONTROL
Xploris, the latest offering from Globisens is an all-in-one STEAM solution combining science data logging, math, coding, control and art.
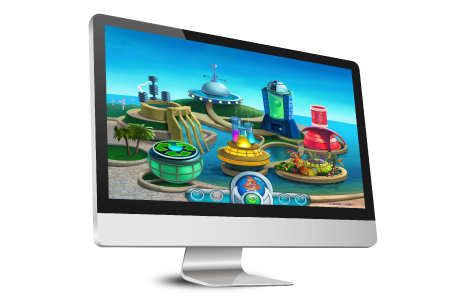
Explore GlobiWorld’s 7 captivating and vivid science theme parks
Compare results and share an enhanced learning outcome
ENJOY A WORLD OF SCIENCE SKILLS AND THRILLS
GLOBIWORLD SOFTWARE
Elementary school students enter the captivating GlobiWorld. Here seven vivid scientific theme parks and interactive science labs can be explored with multiple data formats, analysis tools, science trivia and biographies of famous scientists.
A wealth of learning resources
Each park has a state-of-the-art laboratory, multiple data display and experiment workbooks. Together with biographies of world renowned scientists and amazing science trivia, GlobiWorld is bursting with fun learning tools that appeal to growing minds.
Science that’s accessible
Packaging powerful data analysis tools, such as bar graphs, meters and functions, in a colorful theme park, GlobiWorld offers an enriched learning experience young scientists will never forget.
Science with personality
GlobiWorld puts a face to some of the greatest scientific breakthroughs, with biographies of famous figures like Newton, Apgar and Franklin helping understand the impact of their discoveries.
NEW - GPS data logging!
GlobiWorld integrates Google Maps global positioning for a unique experimentation experience.
CODING THE NEW FRONTIER
XPLORILAB SOFTWARE
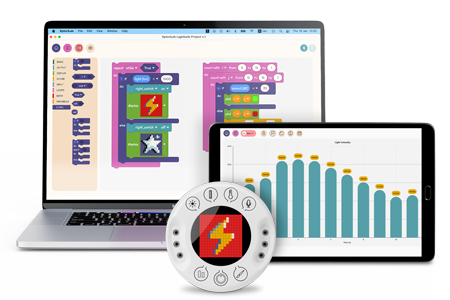
Designed with the Latest Google Flutter platform – XploriLab is consolidating 5 different software modules to deliver an integrated STEAM experience to k-6 students. Young kids will take their first steps in science research using the Sensing module, while older learners will use the Datalogging module for a full scientific data collection and analysis. With Coding, being the new literacy, it is important to have young students experience in creating simple blockbased software, leading to advanced Python programming, with both these tools being part of the XploriLab Coding module. With Coding and Control modules, students are able to make the full use of the Xploris outputs for the operation of small robots, lamps and other devices, while with Art module they can demonstrate their creativity in creating colorful stills and animations.
XploriLab sensing module
XploriLab sensing module is designed for early age scientific research.
Students can measure temperature, light level, sound level, distance and voltage, viewing their readings in vivid and colorful displays of gauges, pictograph and bar graphs.
XploriLab Datalogging module
XploriLab Datalogging module incorporates sophisticated data analysis, lab
reporting, plus wireless communication for full setup and control of the Xploris
built-in sensors. It offers multi-media rich data visualization through Linegraphs,
Tables and Bar-graphs. Graph analysis is made easy using markers,
annotations and mathematical functions such as averaging, linear regression
and more! All through an intuitive man machine interface.
Two engine controls
Xploris includes two engine controls, two 5V outputs and two on/off electronic
switches to respond to data readings from sensors. Now students can take the
next step and direct machines’ output according to changes in their sensors’
readings, such as adjusting greenhouse humidity or temperature according to live
collected data.
Based on Blockly open-source coding
This includes data types, variables, logical operators, If-Else conditions, loops, input and output operations. XploriLab software incorporates a coding editor allowing young users to apply visual programming principles via an intuitive graphical interface. In addition
to the “Blocks” interface for coding, XploriLab also supports high-level Python
programming for higher learning grades.
Digital pixel art
A newly established art form, digital pixel art has made a huge comeback in
recent years. XploriLab offers students a platform for this creative and simple
art form with a set of canvas colors and 16 x 16 LED grid for students to create,
share and present their stills and animations.
MAKE SENSE OF YOUR CHANGING WORLD
GLOBILAB SOFTWARE
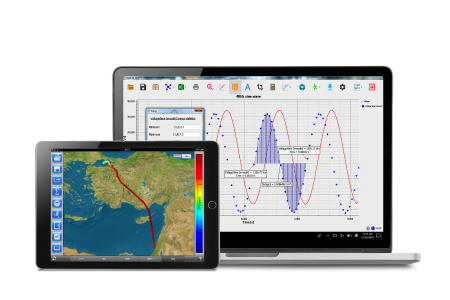
GlobiLab for middle to high school science students incorporates sophisticated data analysis, lab reporting tools, plus wireless communication for full setup and control of the Labdisc and built-in sensors. With multi-media rich data visualization for all computer platforms, GlobiLab software also integrates GPS data logging, plotting your real data over a Google map!
Enabling students to measure their world, analyze real-time data samples and develop a skilled scientific response.
Middle and high school students benefit from GlobiLab’s pioneering platform for experimentation, data analysis and lab reporting. What’s more, wireless communication with the Labdisc hardware allows setup via the software and full control over the data logger and built-in sensors.
Advanced functions and graphical tools
Rich features include crop, markers, zoom and graph annotation. In addition, sophisticated data analysis functions enable users to perform derivative and regression functions, as well as view comprehensive statistics.
Graphical displays
Clearly present real-time experiment data in line graphs, bar graphs and tables.
Multiple vivid meter displays
Updated five times every second and including:
- Analog gauge
- Digital bar
- Thermometer
- Digital value
- Color change
Google Maps with Global Positioning Systems (GPS)
Merging latest sensor, Internet and satellite technologies, the GlobiLab software maps sensor values and plots them as a layer over a Google Map. Leveraging the full Google Maps functionality, such as zoom, panning and the ability to choose a map or a satellite image, this powerful tool, allows data display which indicates the actual location of where measurements took place. Students can map local pollution or weather conditions and compare their data with other schools – opening the door for meaningful collaboration between students all over the world.
TOGETHER YOU CAN DO MORE WITH GLOBICOLLAB
GLOBICOLLAB
As the global scientific community must increasingly work together to combat shared climate and medical crises, Globisens, as part of the Ed-Tech community, is focused on cultivating this next generation of scientist.
A single learning overview
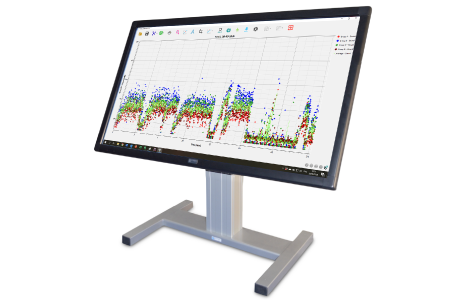
GlobiCollab allows teachers to display, control and analyze the entire class measurements using a single computer. Up to 8 Labdisc units can be wirelessly and simultaneously connected and set to measure any combination of sensors, displaying their data in real-time. Each Labdisc’s measurements are presented in a designated graphic window. Additionally, GlobiCollab will show a combined graphic of all connected Labdisc units, with an average measurement graph of the entire classroom.
Improving the experiment process
Students can now compare their experiment data with graphs showing other students’ data, sharing and learning from each other, and where necessary, adjusting their own experiment setup.
The power of collaboration
Multiple student groups can conduct the same experiment under varying conditions in order to compare and contrast their results. Let’s say, measuring light and temperature in different parts of the classroom, or oxygen production during plant photosynthesis using light projections in different colors. These are just some of the examples of the potential and power for collaborative classroom research made possible by the new GlobiCollab.
integration in any learning environment
With the GlobiCollab there is no need for a computer per Labdisc. The software can also integrate with Interactive White Boards (IWB) or Interactive Flat Panels, where teachers can project the collected data to all students, as well as use the IWB or panels to analyze it.


